Does design thinking actually deliver ROI for Indian product teams?
October 14, 2026

Yes, when it is applied to decisions that are expensive to reverse. McKinsey's 2018 study of 300 companies found top-quartile design performers grew revenue 32 percentage points faster than peers over five years. Forrester's study of IBM's design thinking practice calculated an ROI above 300%, with projects reaching market twice as fast. The return comes from fewer rebuilt features, shorter cycles and higher adoption, measurable within one quarter.
Most Indian product leaders have sat through a design thinking workshop with sticky notes and a wall of "How might we" questions. Fewer can tell their CFO what it returned, which is why these budgets are cut first when a SaaS company tightens spending. We think the problem is not the method but that teams never set up the measurement. Here is what the evidence says, where the money comes from, and how to prove it in your own team.
Two large studies are cited most often, and both hold up because they measure business outcomes rather than satisfaction scores.
McKinsey, "The Business Value of Design" (2018). McKinsey tracked 300 publicly listed companies across medical technology, consumer goods and retail banking over five years and built a Design Index from their design practices. Companies in the top quartile of the index delivered revenue growth 32 percentage points higher and total shareholder returns 56 percentage points higher than their industry peers. The practices that mattered most were design metrics reviewed alongside revenue, cross-functional talent, and continuous iteration with real users.
Forrester, Total Economic Impact of IBM's Design Thinking Practice (2018). Forrester surveyed more than 60 senior executives at Fortune 1000-scale enterprises and interviewed IBM clients. It calculated an ROI of over 300%, found that adequately staffed design teams reached market twice as fast, and recorded up to a 75% reduction in design and development time. One client cut defects by more than half.
Design thinking returns money through four mechanisms. Each one can be traced to a line in your engineering or revenue reports.
| Mechanism | What changes | Where it shows up |
|---|---|---|
| Avoided rework | Features validated with users before build, so fewer are rebuilt or abandoned | Engineering hours on rework; features shipped vs features retired |
| Shorter cycle time | Clear problem framing reduces requirement churn mid-sprint | Idea-to-release time; scope changes per sprint |
| Higher adoption | Features match real workflows, so users switch on and stay | Feature adoption rate; support tickets per feature; churn |
| Faster sales cycles | Product narrative built from customer language, not internal jargon | Demo-to-close time; win rate against incumbents |
The first mechanism is the largest and the easiest to prove. The widely cited IBM Systems Sciences Institute estimate holds that a defect found after release costs four to five times more to fix than one found in design, and up to 100 times more in maintenance. A wrong feature is the most expensive defect of all, because every hour spent building it was wasted before the first bug report arrived.
You do not need a consultancy study. You need a baseline, one quarter of discipline and arithmetic a product manager can do in a spreadsheet.
This is deliberately conservative: it ignores adoption, churn and sales effects. If the rework case alone pays, the rest is upside.
In our consulting work with Indian SaaS and IT services teams, the same four failure patterns appear.
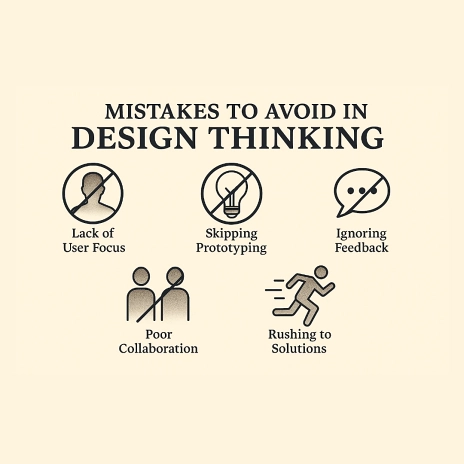
Workshop theatre. A two-day offsite produces a wall of ideas and no decision. Design thinking that does not end in a go, no-go or reshape decision for a specific feature cannot have an ROI, because nothing changed.
Talking to sales instead of users. Founders and account managers are proxies for the loudest customer, not the typical one. Five interviews with actual end users change the answer more often than teams expect.
No baseline. Without the before numbers, improvement is an anecdote. Set the baseline before the first sprint, not after.
Measuring satisfaction instead of behaviour. A post-workshop survey that says participants felt energised is not a business metric. Adoption, rework hours and cycle time are. Our earlier guide to measuring design thinking goes deeper on the metric set.
| Metric | Baseline source | Target direction |
|---|---|---|
| Rework hours as % of engineering hours | Jira or Azure DevOps time logs | Down |
| Features retired within 6 months of launch | Product release log | Down |
| Idea-to-release cycle time | Ticket creation to production deploy | Down |
| 30-day feature adoption rate | Product analytics | Up |
| Support tickets per feature in first 30 days | Helpdesk | Down |
| Feature decisions changed by user evidence | Sprint decision log | Tracked, not targeted |
The last row is the one most teams skip, and it is the one that explains the others. Keep a one-line log of every feature decision that a discovery sprint killed, reshaped or confirmed. After a quarter, that log is your ROI narrative. It also fits naturally into the agile cadence most Indian teams already run; see design thinking in agile and lean workflows for how the two sit together.
Qodequay Technologies is a Pune-based, ISO 9001:2015 and ISO 27001:2022 certified product and consulting company. Our design thinking consulting is built around feature-level decisions rather than offsites: a baseline, a discovery sprint tied to a real roadmap item, a decision at the end of the week, and a metric review one quarter later. The same discipline shapes our own products, Abhigyaan and Data Adhikaar, where a wrong feature costs real users real time.
If you want to run the ROI calculation above on your own roadmap, we will do the baseline exercise with you on a call. Book a 30-minute design thinking ROI conversation.
McKinsey's 2018 study of 300 companies found top-quartile design performers achieved revenue growth 32 percentage points higher and shareholder returns 56 points higher than peers over five years. Forrester's Total Economic Impact study of IBM's design thinking practice calculated an ROI above 300%, with projects reaching market twice as fast.
Rework and cycle-time effects are visible within one quarter if you set a baseline first. A single 5-day discovery sprint that stops one unnecessary feature typically pays for itself immediately, since a mid-size feature costs six to twelve team-weeks to build. Adoption and revenue effects take two to four quarters to show clearly.
Price one team-week of your squad, price the discovery sprint at roughly one team-week plus facilitation, and compare it with the cost of a feature that would otherwise have been built and later retired. Track rework hours, features retired within six months, cycle time and 30-day adoption against a baseline from the previous two quarters.
Because they end in ideas rather than decisions, rely on sales and founders as proxies for users, have no baseline to compare against, and measure participant satisfaction instead of behaviour. Design thinking returns money only when it changes a specific build decision and that change is logged and measured.
Usually yes, because small teams have the least capacity to absorb a wasted build. A startup with one squad that spends one week validating a roadmap item before committing six to twelve weeks of engineering protects a large share of its runway. Keep the exercise tied to a real feature decision and skip the offsite format.

I am a founder director at Qodequay Technologies Pvt. Ltd., a leading digital transformation consulting firm that helps clients across industries to innovate, optimize, and grow their businesses. I have over two decades of experience in the digital domain, spanning product development, e-commerce, user experience, design thinking, web and app development, and business leadership. My core competencies include developing and executing digital transformation strategies, building teams globally, roadmaps, and solutions that leverage data, insights, and emerging technologies such as artificial intelligence, augmented reality, blockchain, and immersive experience. I also have expertise in digital commerce, supply chain integration, and product management, having worked with both B2B and B2C brands in various sectors. My mission is to create value for customers and stakeholders by delivering impactful and engaging digital experiences that drive growth and innovation.
October 14, 2026

October 13, 2026

October 7, 2026

October 6, 2026

October 5, 2026
Monthly insights on AI, VR and DPDPA compliance — straight from our team to your inbox.
Free 30-minute consultation with our team — or see our products in action.