Secure Collaboration Platforms: Protecting Data in the Hybrid Work Era
February 13, 2026
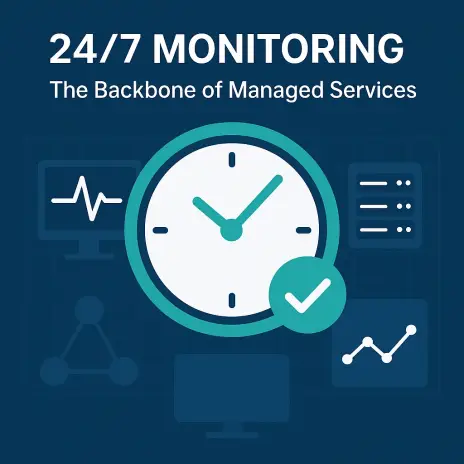
Continuous network monitoring and support are no longer simply nice-to-have features; they are the essential building blocks for any business that operates in the digital realm. A proactive approach to network health enables businesses to prevent small issues from becoming major outages, thus protecting revenue, brand reputation, and customer trust. By implementing a robust framework that includes clear up-time guarantees, advanced monitoring tools, and a structured incident management process, organizations can ensure resilience and deliver on their service promises.
Having a constant eye on your network infrastructure provides significant operational advantages. This proactive stance helps organizations avoid costly downtime and, in turn, improves their overall security and compliance posture.
Uptime guarantees are formal commitments, typically outlined in an SLA, that specify the percentage of time a service will be operational. It is crucial to understand the implications of these guarantees, as the difference between 99% and 99.999% availability can be substantial in terms of annual downtime.
Here are the common availability tiers and their corresponding annual downtime limits:
When defining these guarantees, it's essential to specify the measurement window whether it’s monthly or annual and clearly define what constitutes "downtime." Be sure to also include specific carve-outs for scheduled maintenance or other pre-approved events.
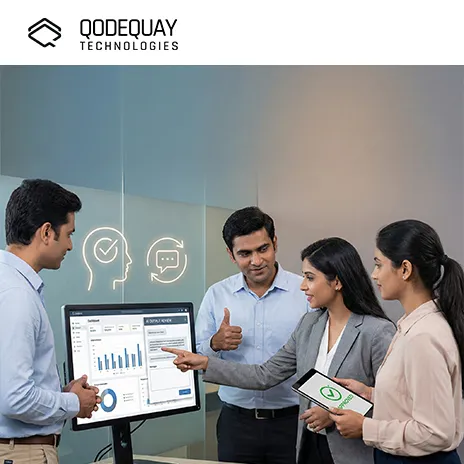
A modern monitoring strategy involves a layered approach that provides visibility across the entire technology stack. This comprehensive view ensures that you can detect and diagnose issues regardless of where they originate.
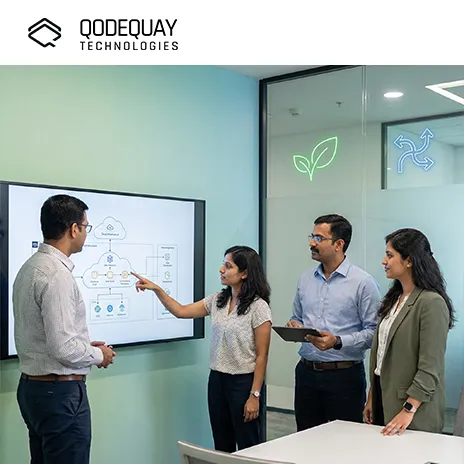
For architecture, a centralized data lake for metrics, logs, and traces is a best practice. This allows for a correlation layer that links data points from different sources, providing a more complete picture of an incident.
A well-defined incident management process is what transforms a simple alert into a swift and effective resolution. It provides a clear roadmap for your team, ensuring that everyone knows their role and the steps to take when an incident occurs.
For a critical (S1) outage, a typical timeline might look like this: alert to acknowledgment in less than 15 minutes, with initial mitigation action taken within 30 minutes.
An SLA is only as good as its enforcement. An effective SLA is built on clear, unambiguous language and a transparent measurement system.
Operational enforcement involves automating SLA calculations, providing monthly reports, and maintaining a transparent status page.
At Qodequay, we understand that a truly resilient network infrastructure is built on a foundation of proactive management and continuous improvement. We leverage a design thinking-led methodology to create network monitoring and support solutions that are not just reactive but are also built for tomorrow's challenges. Our expertise in cutting-edge technologies like Web3, AI, and Mixed Reality allows us to develop sophisticated monitoring systems that go beyond traditional tools.
Our approach to managed services focuses on creating user-centric outcomes. We integrate AI-powered anomaly detection into our monitoring stacks to identify subtle network performance degradation before it becomes a customer-impacting event. This allows us to deliver on higher availability targets and ensures your business can scale without sacrificing reliability. We don't just fix problems; we engineer systems to be inherently more resilient, helping you achieve true digital transformation.
Are you ready to move beyond reactive incident management and embrace a proactive, data-driven approach to network reliability?
Visit Qodequay.com today to learn how our design thinking-led methodology and advanced technology expertise can help your organization build a robust and scalable network infrastructure. Contact us to schedule a consultation and discover how we can help you achieve your digital transformation goals.
At Qodequay, we believe that meaningful innovation starts with understanding people. As a design-first company, we lead with deep empathy—immersing ourselves in the everyday realities, behaviors, and desires of your customers.
Only after decoding real-world pain points do we bring in technology as the enabler. This ensures every solution we build is not just technically sound, but intuitively aligned with human needs.
Whether it's:
We design with purpose, and build with precision.
As the CEO and Founder of Qodequay Technologies, I bring over 20 years of expertise in design thinking, consulting, and digital transformation. Our mission is to merge cutting-edge technologies like AI, Metaverse, AR/VR/MR, and Blockchain with human-centered design, serving global enterprises across the USA, Europe, India, and Australia. I specialize in creating impactful digital solutions, mentoring emerging designers, and leveraging data science to empower underserved communities in rural India. With a credential in Human-Centered Design and extensive experience in guiding product innovation, I’m dedicated to revolutionizing the digital landscape with visionary solutions.
Follow the expert :
![]()

February 13, 2026
February 13, 2026
February 13, 2026

February 13, 2026

February 13, 2026