DPDPA Penalties Up to ₹250 Crore: The Real Cost of Waiting
July 2, 2026

In the rapidly evolving landscape of cloud-native computing, Kubernetes has become the de facto standard for orchestrating containerized applications. While Kubernetes offers unparalleled scalability and resilience, managing and monitoring complex, distributed applications within these environments presents significant challenges. Traditional monitoring approaches, often relying on static thresholds and manual alert correlation, struggle to keep pace with the dynamic nature and sheer volume of data generated by Kubernetes clusters. This is where the integration of Artificial Intelligence (AI) and Machine Learning (ML) insights into monitoring tools becomes not just beneficial, but essential.
The advent of AI/ML-powered Kubernetes monitoring tools marks a paradigm shift, moving beyond reactive problem-solving to proactive identification and even prediction of issues. These advanced tools leverage sophisticated algorithms to analyze vast streams of metrics, logs, and traces, automatically detecting anomalies, predicting potential failures, and providing intelligent root cause analysis. This capability transforms operational efficiency, reduces downtime, and allows development and operations teams to focus on innovation rather than constant firefighting.
This comprehensive guide will delve deep into the world of Kubernetes monitoring tools enhanced with AI/ML insights. We will explore what these tools are, why they are crucial in today's fast-paced digital environment, and how they can revolutionize your operational strategies. Readers will gain a thorough understanding of their core components, benefits, and practical implementation steps. We will also address common challenges and offer expert-level solutions, alongside a glimpse into the future of this transformative technology. By the end of this guide, you will be equipped with the knowledge to harness the power of AI/ML for superior Kubernetes observability and performance.
Kubernetes monitoring tools with AI/ML insights represent a new generation of observability platforms designed to manage the complexity of modern containerized applications orchestrated by Kubernetes. Unlike conventional monitoring systems that primarily collect and display data, these advanced tools incorporate artificial intelligence and machine learning algorithms to process, analyze, and interpret that data in a much more intelligent and automated fashion. They move beyond simple threshold-based alerts to understand patterns, predict behavior, and identify anomalies that human operators might miss or take too long to detect. This integration allows for a more proactive and predictive approach to maintaining the health, performance, and availability of Kubernetes clusters and the applications running within them.
At its core, the concept involves feeding vast amounts of operational data—such as CPU utilization, memory consumption, network traffic, pod restarts, error rates from logs, and application traces—into sophisticated AI/ML models. These models are trained to recognize normal operating conditions and deviations from those norms. For instance, instead of just alerting when CPU usage crosses a fixed 80% threshold, an AI-driven system might learn that a particular microservice typically runs at 60% CPU but occasionally spikes to 90% during specific peak hours. If it then observes a sustained 90% usage during off-peak hours, or a sudden, unexplained drop to 20%, it can flag this as an anomaly, even if it doesn't violate a simple static threshold. This nuanced understanding of system behavior is crucial for preventing outages and optimizing resource allocation in dynamic Kubernetes environments.
The importance of these tools lies in their ability to cut through the noise of millions of data points generated by hundreds or thousands of containers and microservices. They provide actionable insights, reduce alert fatigue, and accelerate root cause analysis. For example, if an application starts experiencing latency, an AI/ML-powered tool can not only detect the latency but also correlate it with recent code deployments, resource saturation in a specific node, or even a particular database query, pinpointing the exact service or component responsible. This capability transforms incident response from a time-consuming, manual investigation into a streamlined, automated process, significantly improving mean time to resolution (MTTR) and overall system reliability.
The effectiveness of Kubernetes monitoring tools with AI/ML insights hinges on several key components working in concert. First, robust data ingestion and collection mechanisms are essential. These tools must efficiently gather metrics (e.g., Prometheus, cAdvisor), logs (e.g., Fluentd, Logstash), and traces (e.g., OpenTelemetry, Jaeger) from all layers of the Kubernetes stack, including nodes, pods, containers, and applications. This raw data forms the foundation for all subsequent analysis.
Second, a powerful AI/ML engine is the brain of the operation. This component houses various algorithms for anomaly detection, predictive analytics, correlation, and root cause analysis. It continuously processes the ingested data, builds baselines of normal behavior, identifies statistical outliers, forecasts future resource needs, and links disparate events to uncover underlying problems. This engine often employs techniques like time-series analysis, clustering, and deep learning to derive meaningful insights.
Third, intelligent alerting and notification systems are critical. Beyond simple threshold alerts, these systems leverage AI/ML to prioritize alerts based on severity, potential impact, and historical patterns, reducing false positives and ensuring that operations teams only receive notifications for truly critical issues. They can also group related alerts into incidents, providing a holistic view of a problem rather than a flood of individual warnings.
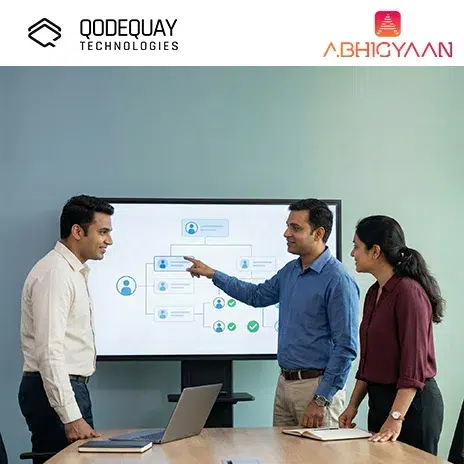
Finally, advanced visualization and reporting dashboards are necessary to present complex AI/ML insights in an understandable and actionable format. These dashboards often include interactive graphs, topology maps showing service dependencies, and incident timelines, allowing users to quickly grasp the health of their cluster, understand the context of an anomaly, and track performance trends over time. Integration capabilities with other DevOps tools, such as incident management systems (e.g., PagerDuty) and CI/CD pipelines, further enhance their utility.
The primary advantages of adopting Kubernetes monitoring tools with AI/ML insights are transformative for any organization running containerized applications. One of the most significant benefits is proactive problem detection and prevention. Instead of reacting to outages after they occur, AI/ML models can predict potential issues, such as resource exhaustion or impending service degradation, allowing teams to intervene before users are impacted. For example, an AI might detect a gradual increase in memory usage across a deployment that, based on historical trends, will lead to an out-of-memory error in the next few hours, triggering an alert for scaling up resources.
Another crucial benefit is reduced alert fatigue and improved signal-to-noise ratio. Traditional monitoring often bombards engineers with a deluge of alerts, many of which are non-critical or false positives. AI/ML algorithms intelligently filter and prioritize alerts, focusing on genuine anomalies and critical events. This means engineers spend less time sifting through irrelevant notifications and more time addressing real issues, leading to higher job satisfaction and more efficient operations.
Furthermore, these tools offer accelerated root cause analysis. In complex Kubernetes environments with hundreds of microservices, identifying the exact cause of a problem can be a daunting task. AI/ML can automatically correlate events across different layers—from infrastructure to application code—to pinpoint the precise source of an issue. For instance, if an application becomes slow, the AI can quickly identify if it's due to a specific database query, a bottleneck in a particular microservice, or an underlying network issue on a node, drastically cutting down the mean time to resolution (MTTR).
Finally, optimized resource utilization and cost savings are substantial advantages. By understanding workload patterns and predicting future resource needs, AI/ML-powered tools can recommend optimal scaling strategies for pods and nodes. This prevents over-provisioning resources "just in case," leading to significant cost reductions in cloud infrastructure while ensuring applications always have the capacity they need. It also helps in identifying underutilized resources that can be scaled down or repurposed.
In 2024, the relevance of Kubernetes monitoring tools with AI/ML insights has grown exponentially due to several converging factors: the increasing scale and complexity of cloud-native architectures, the relentless demand for high availability and performance, and the growing pressure on DevOps teams to do more with less. As organizations continue to embrace microservices and deploy applications across multiple clusters and hybrid cloud environments, the sheer volume and velocity of operational data become unmanageable for human operators alone. AI/ML provides the necessary intelligence to make sense of this data deluge, transforming it into actionable insights that drive operational excellence.
The dynamic nature of Kubernetes, with its auto-scaling, self-healing, and rolling updates, means that the environment is constantly changing. Static thresholds and manual observation are simply inadequate for monitoring such fluid systems. AI/ML models, however, can adapt to these changes, continuously learning new baselines and identifying anomalies against a shifting normal. This adaptability is critical for maintaining robust operations in environments where applications are frequently updated and scaled. Moreover, the competitive landscape demands near-perfect uptime and performance. Any downtime or performance degradation can directly impact customer satisfaction, revenue, and brand reputation. AI/ML-driven monitoring acts as a critical safeguard, ensuring that potential issues are detected and addressed before they escalate into major incidents, thereby directly contributing to business continuity and success.
The skills gap in cloud-native operations is another significant driver. As Kubernetes adoption accelerates, there aren't enough experienced engineers to manually manage and troubleshoot every aspect of these complex systems. AI/ML tools democratize advanced monitoring capabilities, allowing teams to achieve expert-level observability without requiring every engineer to be a Kubernetes guru. They automate mundane tasks, provide clear explanations for complex issues, and guide engineers toward solutions, effectively augmenting human capabilities and making operations more efficient and less prone to human error. This augmentation is not just about automation; it's about intelligent automation that empowers teams to focus on strategic initiatives rather than reactive firefighting.
The market impact of Kubernetes monitoring tools with AI/ML insights is profound and multifaceted. These tools are rapidly becoming a differentiator for businesses that prioritize operational resilience and efficiency. Organizations that adopt them gain a significant competitive edge by reducing downtime, improving application performance, and optimizing cloud spending. This translates into better customer experiences, higher service level agreement (SLA) adherence, and ultimately, increased revenue and market share. The ability to quickly identify and resolve issues means that development cycles can be faster, as teams have more confidence in the stability of their production environments.
Furthermore, the demand for these sophisticated monitoring solutions is fueling innovation within the observability space. Vendors are continuously enhancing their AI/ML capabilities, offering more advanced anomaly detection, predictive analytics, and automated remediation features. This creates a vibrant ecosystem where businesses have access to increasingly powerful tools tailored to their specific needs. The market is also seeing a shift from siloed monitoring solutions to integrated platforms that combine metrics, logs, and traces with AI/ML-driven insights, providing a unified view of the entire Kubernetes stack. This consolidation simplifies tooling and streamlines workflows for DevOps and SRE teams, making complex operations more manageable.
The future relevance of Kubernetes monitoring tools with AI/ML insights is undeniable and will only grow stronger. As Kubernetes continues to evolve and integrate with emerging technologies like serverless functions, edge computing, and WebAssembly, the complexity of managing these distributed systems will intensify. AI/ML will be indispensable in navigating this complexity. We can expect to see even more sophisticated predictive capabilities, moving beyond simple anomaly detection to truly anticipate cascading failures across highly interconnected services. The integration of AI/ML will extend to automated self-healing, where tools not only identify problems but also trigger automated actions, such as scaling up resources, restarting problematic pods, or rolling back faulty deployments, without human intervention.
Moreover, the explainability of AI/ML models in monitoring will become a key focus. As these systems become more autonomous, engineers will need to understand why an AI made a particular recommendation or detected a specific anomaly. Future tools will provide clearer justifications and context for their insights, building trust and enabling better decision-making. The trend towards AIOps (AI for IT Operations) will see these monitoring tools become central components of broader operational intelligence platforms, integrating with incident management, security, and capacity planning systems to provide a holistic, intelligent approach to IT operations. This evolution will solidify AI/ML's role as the backbone of resilient, high-performing Kubernetes environments for years to come.
Embarking on the journey of implementing Kubernetes monitoring tools with AI/ML insights requires a structured approach to ensure successful integration and maximum benefit. The initial phase involves understanding your current Kubernetes environment, identifying key monitoring objectives, and selecting a tool that aligns with your specific needs and existing technology stack. It's not merely about deploying an agent; it's about establishing a comprehensive observability strategy that leverages intelligent analytics. A good starting point is to define what success looks like: Are you aiming to reduce MTTR, optimize cloud costs, improve application performance, or enhance security posture? Clearly articulated goals will guide your tool selection and implementation process.
Once objectives are clear, the next step involves evaluating available tools. Leading solutions in this space often include offerings from Datadog, Dynatrace, New Relic, Splunk Observability Cloud, and others, each with varying strengths in AI/ML capabilities, integration ecosystems, and pricing models. Consider factors such as ease of deployment, breadth of data collection (metrics, logs, traces), the sophistication of their AI/ML engine (e.g., anomaly detection, predictive analytics, root cause analysis), visualization capabilities, and integration with your existing incident management and CI/CD tools. Many providers offer free trials, which are invaluable for testing the tool's fit within your environment and assessing its AI/ML insights firsthand.
After selecting a tool, the implementation typically begins with deploying the necessary agents or collectors across your Kubernetes clusters. These agents are responsible for gathering the raw telemetry data. Following data collection, you'll configure the tool to process and analyze this data using its built-in AI/ML capabilities. This often involves setting up initial dashboards, defining alert policies (which the AI/ML engine will then enhance), and potentially training the models with historical data if the tool supports custom model training. A practical example might involve deploying a Datadog Agent as a DaemonSet across your Kubernetes nodes, configuring it to collect metrics from Prometheus endpoints, logs from all containers, and traces from your application services. Datadog's Watchdog AI then automatically analyzes this data, learns normal behavior, and starts identifying anomalies or correlating events, such as a sudden increase in pod restarts linked to a specific deployment error.
Before you can effectively implement Kubernetes monitoring tools with AI/ML insights, several prerequisites need to be in place to ensure a smooth and successful deployment. First and foremost, you need a running Kubernetes cluster (or multiple clusters) where your applications are deployed. This includes having administrative access to the cluster to deploy monitoring agents, create necessary roles, and configure network policies.
Second, a foundational understanding of Kubernetes concepts is crucial. This means familiarity with pods, deployments, services, namespaces, nodes, and kubectl commands. While AI/ML tools simplify monitoring, knowing the underlying architecture helps in interpreting insights and troubleshooting.
Third, you will need sufficient compute and storage resources for the monitoring solution itself. AI/ML processing, especially for large clusters, can be resource-intensive. Ensure your chosen monitoring tool has adequate resources allocated, whether it's a SaaS solution or a self-hosted one requiring dedicated infrastructure.
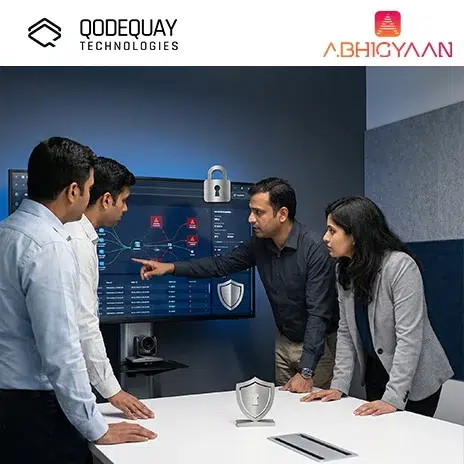
Fourth, consider your data retention policies and compliance requirements. Monitoring data, especially logs and traces, can contain sensitive information. Ensure your chosen tool and its configuration comply with relevant regulations (e.g., GDPR, HIPAA) and your internal data governance policies.
Finally, network connectivity and security configurations are vital. Monitoring agents need to be able to communicate with the monitoring platform, which might involve opening specific ports, configuring firewalls, or setting up private endpoints. Secure communication channels (e.g., TLS) should always be enforced to protect sensitive operational data in transit.
Implementing Kubernetes monitoring tools with AI/ML insights can be broken down into a series of logical steps:
Tool Selection and Planning: Based on your objectives and prerequisites, select the best-fit monitoring tool. Plan your deployment strategy, considering aspects like multi-cluster support, data retention, and integration with existing systems. For instance, if you prioritize predictive analytics, you might lean towards tools known for strong time-series forecasting capabilities.
Agent Deployment: Deploy the monitoring agent or collector across your Kubernetes cluster(s). This is typically done using Helm charts or Kubernetes manifests (DaemonSets, Deployments) provided by the vendor. For example, you might run helm install my-datadog-agent datadog/datadog --set datadog.apiKey=<YOUR_API_KEY> to deploy the Datadog agent. Ensure the agents have the necessary permissions (via RBAC) to collect metrics, logs, and traces from all relevant Kubernetes resources.
Data Configuration and Ingestion: Configure the agents to collect the specific types of data you need. This includes enabling metric collection from cAdvisor and kube-state-metrics, configuring log forwarding from all containers, and instrumenting your applications for distributed tracing. Many tools offer auto-discovery features for services and applications, simplifying this step. For example, configuring a Splunk agent to collect logs from all pods in a specific namespace.
Baseline Establishment and AI/ML Model Training: Allow the tool to run for a period (e.g., a few days to weeks) to collect sufficient data and establish baselines of normal behavior. During this phase, the AI/ML engine will learn the patterns and characteristics of your environment. Some tools allow you to feed historical data for faster initial model training.
Dashboard Creation and Visualization: Create custom dashboards that provide a clear overview of your cluster's health, application performance, and resource utilization. Leverage the tool's visualization capabilities to display AI/ML insights, such as anomaly detection graphs, predicted resource trends, and correlated events. For instance, a dashboard might show a graph of CPU utilization with an overlay highlighting AI-detected anomalies.
Alerting and Notification Setup: Configure intelligent alerts based on AI/ML-driven insights. Instead of static thresholds, use anomaly detection alerts that trigger only when behavior deviates significantly from the learned norm. Integrate these alerts with your preferred notification channels (e.g., Slack, PagerDuty, email) and incident management systems. An example would be setting up an alert that fires when the AI detects an unusual increase in error rates for a specific microservice, even if the absolute error rate is still below a traditional "critical" threshold.
Refinement and Optimization: Continuously monitor the effectiveness of your AI/ML insights. Fine-tune alert sensitivities, adjust data collection parameters, and provide feedback to the AI models if you encounter false positives or missed anomalies. This iterative process ensures the monitoring system becomes increasingly accurate and valuable over time. Regularly review the insights provided by the AI to understand your system better and identify areas for improvement.
To truly unlock the potential of Kubernetes monitoring tools with AI/ML insights, it's crucial to adopt a set of best practices that go beyond mere tool deployment. These practices ensure that the insights generated are accurate, actionable, and contribute meaningfully to operational efficiency and reliability. One fundamental best practice is to treat your monitoring configuration as code, using tools like GitOps to manage and version control your monitoring manifests, alerts, and dashboards. This ensures consistency, reproducibility, and easier collaboration across teams, preventing configuration drift and simplifying audits. By storing your monitoring setup in a Git repository, any changes can be reviewed, approved, and automatically applied, much like application code.
Another critical best practice is to focus on collecting the right data, not just all data. While AI/ML thrives on large datasets, collecting irrelevant or low-quality data can introduce noise, increase costs, and potentially lead to misleading insights. Prioritize metrics, logs, and traces that are directly relevant to application performance, user experience, and resource health. For instance, ensure you're collecting detailed application-level metrics (e.g., request latency, error counts for specific API endpoints) in addition to infrastructure metrics. Regularly review your data collection strategy to prune unnecessary data sources and optimize the granularity of collected data, balancing insight with storage and processing costs. This targeted approach helps the AI/ML models focus on the most impactful information, leading to more precise anomaly detection and root cause analysis.
Furthermore, fostering a culture of continuous learning and feedback is paramount. AI/ML models are only as good as the data they are trained on and the feedback they receive. Encourage your SRE and DevOps teams to actively engage with the AI-generated insights, providing feedback on the accuracy of anomaly detections, the relevance of correlated events, and the helpfulness of root cause suggestions. This human-in-the-loop approach helps to refine the models over time, reducing false positives and improving the overall intelligence of the monitoring system. Regularly review incidents where AI/ML insights played a role, documenting what worked well and what could be improved, to continuously enhance the system's effectiveness.
Adhering to industry standards is vital for building a robust and scalable Kubernetes monitoring strategy, even with AI/ML enhancements. The concept of OpenTelemetry has emerged as a critical standard for instrumenting applications to generate metrics, logs, and traces. By adopting OpenTelemetry, organizations ensure vendor neutrality for data collection, making it easier to switch monitoring tools or integrate multiple solutions without re-instrumenting applications. This standardization allows AI/ML tools to consume a consistent stream of high-quality telemetry data, regardless of the underlying application language or framework.
Another key industry standard is the four golden signals of monitoring: latency, traffic, errors, and saturation. These signals, popularized by Google's Site Reliability Engineering (SRE) practices, provide a comprehensive view of service health. AI/ML-powered tools should be configured to prioritize the analysis of these signals, using them as primary indicators for anomaly detection and predictive analytics. For example, an AI might detect a subtle increase in latency combined with a rise in error rates for a specific service, even if saturation metrics appear normal, indicating a potential application-level issue that a human might overlook.
Finally, adopting GitOps principles for managing monitoring configurations is becoming an industry standard. This involves storing all monitoring-related configurations (dashboards, alerts, recording rules, agent configurations) in a Git repository. Changes are made via pull requests, reviewed, and then automatically applied to the clusters. This practice ensures that monitoring configurations are version-controlled, auditable, and consistent across environments, which is especially important when dealing with complex AI/ML-driven alert logic that needs to be precisely managed.
Beyond general best practices, expert recommendations for maximizing the value of AI/ML-powered Kubernetes monitoring tools often emphasize strategic implementation and continuous refinement. One such recommendation is to start small and iterate. Instead of trying to monitor everything with AI/ML from day one, begin by applying these advanced capabilities to your most critical services or those with historically high incident rates. This allows your teams to gain familiarity with the tool's insights, build confidence, and refine the AI models in a controlled environment before rolling it out more broadly.
Another expert tip is to integrate AI/ML insights into your existing incident response workflows. The most powerful AI/ML tool is useless if its insights don't reach the right people at the right time or if they don't integrate seamlessly into your current operational processes. Ensure that AI-generated alerts are routed to the appropriate teams, enriched with context, and linked to your incident management system. Consider automating initial diagnostic steps or even remediation actions based on AI-identified root causes, such as automatically scaling a deployment or restarting a problematic pod, under strict conditions.
Furthermore, invest in continuous learning and skill development for your operations teams. While AI/ML tools simplify many aspects of monitoring, understanding how these algorithms work, how to interpret their outputs, and how to fine-tune them requires a certain level of expertise. Provide training on the specific AI/ML features of your chosen tool, and encourage engineers to learn about the underlying concepts of machine learning for observability. This empowers your team to leverage the tools more effectively, challenge AI insights when necessary, and contribute to the ongoing improvement of your monitoring system.
While Kubernetes monitoring tools with AI/ML insights offer immense benefits, their implementation and ongoing management are not without challenges. Organizations often encounter several typical problems that can hinder their effectiveness and adoption. One of the most frequent issues is data overload and noise. Despite the promise of AI/ML to reduce noise, if data collection is not properly configured, or if the environment is inherently chaotic, the sheer volume of metrics, logs, and traces can still overwhelm the system. This can lead to the AI/ML engine struggling to establish clear baselines, resulting in an abundance of false positives or, conversely, missing subtle anomalies amidst the deluge of data. For example, if every minor configuration change or transient network glitch generates a flurry of alerts, teams quickly become desensitized.
Another significant challenge is the complexity of integration and setup. Deploying monitoring agents across a distributed Kubernetes cluster, configuring them to collect diverse data types, and then integrating the monitoring platform with existing CI/CD pipelines, incident management systems, and other operational tools can be a complex and time-consuming endeavor. Each component needs to be correctly configured, and any misstep can lead to incomplete data collection or broken workflows. This complexity is compounded in multi-cloud or hybrid environments where different security policies and network configurations need to be managed, making a unified observability strategy difficult to achieve.
Furthermore, skill gaps and a lack of understanding within teams can pose a substantial barrier. While AI/ML tools aim to simplify operations, effectively leveraging their advanced features requires a certain level of expertise in both Kubernetes and the principles of machine learning. Teams may struggle to interpret complex AI-generated insights, understand why a particular anomaly was flagged, or know how to fine-tune the models to improve accuracy. This can lead to underutilization of the tool's capabilities or a lack of trust in its recommendations, ultimately undermining the investment. Without proper training and a clear understanding of the tool's intelligence, teams might revert to traditional, less effective monitoring methods.
Among the typical problems, some issues surface more frequently than others, directly impacting the operational efficiency and reliability of AI/ML-driven Kubernetes monitoring.
Understanding the root causes behind these frequent issues is key to developing effective solutions.
Addressing the common challenges associated with Kubernetes monitoring tools with AI/ML insights requires a combination of strategic planning, technical adjustments, and continuous refinement. For the pervasive issue of false positives and alert fatigue, a key solution lies in iterative model refinement and contextual enrichment. Instead of accepting initial model outputs as gospel, actively provide feedback to the AI/ML system. Many advanced tools allow users to mark alerts as false positives, which helps retrain the models over time. Additionally, integrate contextual information such as planned maintenance windows, known application deployments, or expected traffic spikes. For example, if a deployment causes a temporary spike in CPU, feeding this context to the monitoring tool can prevent it from flagging it as an anomaly. This continuous feedback loop and contextual awareness significantly improve the accuracy of anomaly detection.
To tackle the complexity of integration and setup, organizations should prioritize leveraging vendor-provided automation and adopting standardized practices. Most leading monitoring tools offer Helm charts, Kubernetes operators, or cloud-native integrations that simplify agent deployment and configuration. Embrace OpenTelemetry for application instrumentation to ensure consistent data formats across services, reducing integration headaches. Furthermore, utilize Infrastructure as Code (IaC) tools like Terraform or Pulumi to manage the monitoring platform's configuration, ensuring reproducibility and consistency. For instance, using a Terraform module to deploy and configure your monitoring solution across all clusters ensures that the setup is identical and reduces manual errors, streamlining the entire process.
Addressing skill gaps and fostering understanding within teams can be achieved through targeted training and fostering a culture of observability. Provide comprehensive training sessions on the chosen monitoring tool, focusing not just on its features but also on how its AI/ML capabilities work and how to interpret their insights. Encourage cross-functional collaboration between SREs, developers, and data scientists. Create internal documentation and run workshops that explain the underlying principles of AI/ML in monitoring. For example, a workshop could demonstrate how a specific anomaly detection algorithm works by showing examples of normal and anomalous patterns. This empowers teams to trust the AI's recommendations, contribute to its improvement, and ultimately become more proficient in managing complex Kubernetes environments.
For immediate relief from common problems, several quick fixes can be implemented:
For sustainable improvement and to prevent recurring issues, long-term solutions are essential:
Moving beyond basic implementation, expert-level strategies for Kubernetes monitoring tools with AI/ML insights focus on maximizing their predictive power, optimizing their performance, and integrating them deeply into the entire software development lifecycle. One advanced technique involves proactive anomaly detection and predictive capacity planning using multivariate analysis. Instead of just looking at individual metrics, sophisticated AI/ML models can analyze multiple correlated metrics simultaneously to detect subtle anomalies that might indicate an impending issue. For example, a slight increase in network latency combined with a minor rise in error rates and a specific pattern of garbage collection pauses across several microservices might collectively signal a looming problem, even if no single metric crosses a static threshold. This multivariate approach provides a much richer context for anomaly detection and allows for earlier intervention.
Another expert-level strategy is the implementation of intelligent alert correlation and suppression based on service dependencies and blast radius analysis. In large Kubernetes environments, a single underlying issue can trigger hundreds of alerts across dependent services. Advanced AI/ML tools can build a dynamic topology map of your services and their dependencies, using this information to group related alerts into a single incident and suppress redundant notifications. Furthermore, they can perform blast radius analysis, predicting which other services or user experiences might be affected by a detected anomaly. For instance, if a database pod is experiencing issues, the AI can identify all upstream applications that depend on it and notify only the relevant teams with a consolidated, high-priority alert, significantly reducing alert fatigue and accelerating incident response.
Finally, integrating AI/ML-driven insights directly into CI/CD pipelines for pre-production validation represents a cutting-edge approach. Instead of waiting for issues to appear in production, advanced teams use their monitoring tools to analyze performance metrics and logs from staging or canary deployments. The AI/ML engine can compare the behavior of a new deployment against historical baselines or against the current production environment. If the AI detects performance regressions, increased error rates, or unusual resource consumption patterns in the pre-production environment, it can automatically halt the deployment or flag it for manual review. This proactive quality gate, powered by intelligent insights, prevents problematic code from ever reaching production, significantly improving release reliability and reducing the cost of fixing defects.
Advanced methodologies in Kubernetes monitoring with AI/ML insights push the boundaries of traditional observability, focusing on deeper analytical capabilities and more intelligent automation.
To maximize the efficiency and effectiveness of AI/ML-driven Kubernetes monitoring, several optimization strategies are crucial:
team:frontend and environment:production allows the AI to group and analyze data more intelligently.The future of Kubernetes monitoring tools with AI/ML insights is poised for even greater sophistication, autonomy, and integration, fundamentally transforming how organizations manage their cloud-native infrastructure. We are moving towards a landscape where monitoring systems are not just observers but active participants in maintaining system health and performance. The evolution will be driven by advancements in AI/ML research, increasing complexity of distributed systems, and the continuous demand for higher levels of automation and resilience. The vision is an environment where systems can largely self-manage, predict their own failures, and even self-heal, minimizing human intervention and maximizing operational efficiency.
One key aspect of this future will be the development of more explainable AI (XAI) in observability. As AI/ML models become more complex and autonomous, the need for transparency and interpretability will become paramount. Future tools will not only tell you what is happening and what the root cause is, but also why the AI made that determination, providing clear, human-understandable explanations for its insights and recommendations. This will build greater trust in AI-driven decisions and empower engineers to learn from the system, rather than simply reacting to its outputs. For example, an AI might explain that a predicted outage is due to a specific microservice's memory leak, evidenced by a particular pattern in its heap usage over the last 24 hours, correlated with recent deployment X.
Another significant trend will be the shift towards proactive self-healing and autonomous operations. Current AI/ML monitoring tools excel at detection and prediction; the next frontier is automated remediation. Future systems will leverage AI to not only identify potential issues but also to automatically trigger corrective actions, such as dynamically adjusting resource allocations, rolling back problematic deployments, or even reconfiguring network policies, all without direct human intervention. This will move us closer to truly "lights-out" operations for many routine incidents, allowing SRE teams to focus on strategic initiatives and complex, novel problems. This level of autonomy will be carefully governed by policies and safeguards, ensuring that automated actions are safe and reversible.
Several emerging trends are shaping the future of AI/ML-powered Kubernetes monitoring:
To stay ahead of these upcoming changes and fully leverage the future of AI/ML-driven Kubernetes monitoring, organizations should adopt several proactive strategies:
Explore these related topics to deepen your understanding:
The journey through the landscape of Kubernetes monitoring tools with AI/ML insights reveals a powerful evolution in how we manage and maintain complex cloud-native applications. We've explored how these advanced tools transcend traditional monitoring by leveraging artificial intelligence and machine learning to provide proactive problem detection, accelerate root cause analysis, reduce alert fatigue, and optimize resource utilization. From understanding their core components and benefits to navigating the intricacies of implementation and addressing common challenges, it's clear that AI/ML is not just an enhancement but a fundamental shift towards more intelligent, resilient, and efficient Kubernetes operations.
The strategic adoption of these tools, coupled with best practices like standardized instrumentation, continuous model refinement, and a culture of observability, empowers organizations to move from reactive firefighting to proactive problem prevention. By embracing advanced methodologies such as multivariate analysis, predictive capacity planning, and integrating AI/ML into CI/CD pipelines, businesses can achieve expert-level operational excellence. Looking ahead, the future promises even greater autonomy, explainability, and integration, with AI/ML driving self-healing systems and context-aware observability that will further revolutionize cloud-native management.
For businesses operating in today's dynamic digital environment, leveraging Kubernetes monitoring tools with AI/ML insights is no longer a luxury but a strategic imperative. The ability to anticipate issues, optimize performance, and ensure uninterrupted service directly translates into competitive advantage and enhanced customer satisfaction. The actionable next step is to evaluate your current monitoring strategy, identify areas where AI/ML can provide the most impact, and begin exploring the leading tools available. Start small, iterate, and continuously refine your approach, and you will unlock unparalleled levels of operational efficiency and reliability for your Kubernetes deployments.
Qodequay combines design thinking with expertise in AI, Web3, and Mixed Reality to help businesses implement Best Kubernetes Monitoring Tools with AI/ML Insights effectively. Our methodology ensures user-centric solutions that drive real results and digital transformation.
Ready to implement Best Kubernetes Monitoring Tools with AI/ML Insights for your business? Contact Qodequay today to learn how our experts can help you succeed. Visit Qodequay.com or schedule a consultation to get started.
As the CEO and Founder of Qodequay Technologies, I bring over 20 years of expertise in design thinking, consulting, and digital transformation. Our mission is to merge cutting-edge technologies like AI, Metaverse, AR/VR/MR, and Blockchain with human-centered design, serving global enterprises across the USA, Europe, India, and Australia. I specialize in creating impactful digital solutions, mentoring emerging designers, and leveraging data science to empower underserved communities in rural India. With a credential in Human-Centered Design and extensive experience in guiding product innovation, I’m dedicated to revolutionizing the digital landscape with visionary solutions.
Follow the expert :
![]()

July 2, 2026

July 2, 2026
July 2, 2026
July 2, 2026

July 2, 2026
Monthly insights on AI, VR and DPDPA compliance — straight from our team to your inbox.
Free 30-minute consultation with our team — or see our products in action.